---
title: Doughnut 环状图
group:
title: 数据图表
order: 2
---
# BrnDoughnutChart
环状图通过扇形区块的面积,弧度和颜色等视觉标记,展现数据的分类和占比情况。它的特点是展现部分与部分之间,以及部分与整体的关系。部分相加之和等于整体的 100%,用整圆表示
## 一、效果总览
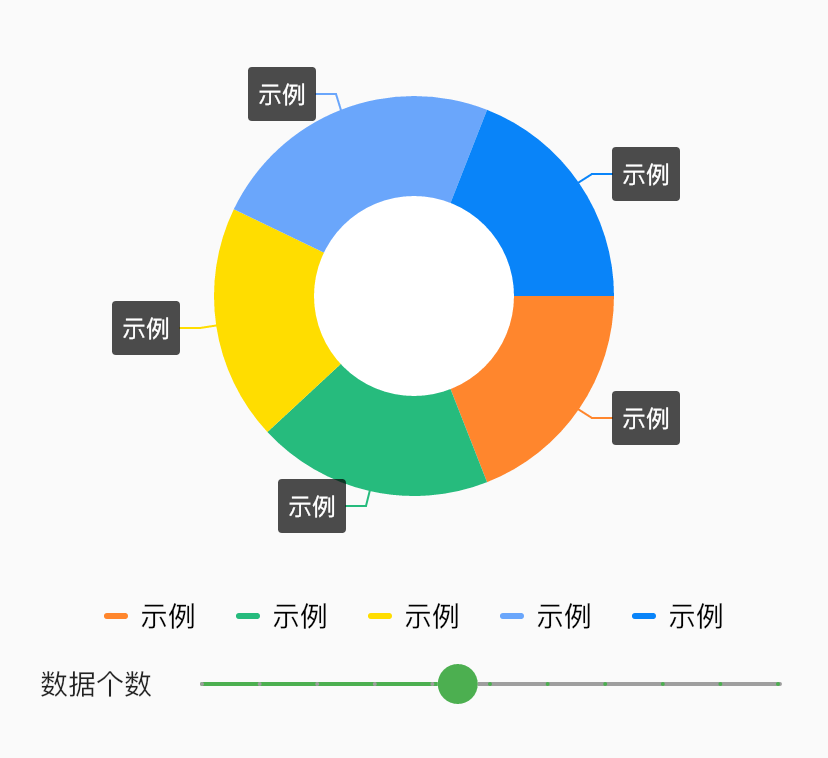 ## 二、描述
### 适用场景
1. 饼图主要包括图形、标签、图例等内容
2. 展现部分与部分之间,以及部分与整体的关系
3. 部分相加之和等于整体的 100%,用整圆表示
## 三、构造函数及参数说明
### 构造函数
```dart
BrnDoughnutChart(
{this.width = 0,
this.height = 0,
this.padding = EdgeInsets.zero,
this.ringWidth = 50,
required this.data,
this.fontSize = 12,
this.fontColor = Colors.white,
this.selectedItem,
this.showTitleWhenSelected = false,
this.selectCallback});
```
### 参数说明
| **参数名** | **参数类型** | **描述** | **是否必填** | **默认值** |
| --- | --- | --- | --- | --- |
| width | double | 宽 | 否 | 0 |
| height | double | 高 | 否 | 0 |
| padding | EdgeInsetsGeometry | 内边距 | 否 | EdgeInsets.zero |
| ringWidth | int | 圆环宽度 | 否 | 50 |
| data | `List` | 饼图数据 | 是 | |
| fontSize | double | 选中时展示文字大小 | 否 | 12 |
| fontColor | Color | 选中时展示文字颜色 | 否 | Colors.white |
| selectedItem | BrnDoughnutDataItem? | 选中的项目 | 否 | |
| selectCallback | BrnDoughnutSelectCallback? | 选中项目时候的回掉 | 否 | |
| showTitleWhenSelected | bool | 是否仅在选中时展示 title | 否 | false |
### 其他数据
```dart
DoughnutChartLegend(
{this.legendStyle = BrnDoughnutChartLegendStyle.wrap,
required this.data});
```
## 四、代码演示
### 效果一
## 二、描述
### 适用场景
1. 饼图主要包括图形、标签、图例等内容
2. 展现部分与部分之间,以及部分与整体的关系
3. 部分相加之和等于整体的 100%,用整圆表示
## 三、构造函数及参数说明
### 构造函数
```dart
BrnDoughnutChart(
{this.width = 0,
this.height = 0,
this.padding = EdgeInsets.zero,
this.ringWidth = 50,
required this.data,
this.fontSize = 12,
this.fontColor = Colors.white,
this.selectedItem,
this.showTitleWhenSelected = false,
this.selectCallback});
```
### 参数说明
| **参数名** | **参数类型** | **描述** | **是否必填** | **默认值** |
| --- | --- | --- | --- | --- |
| width | double | 宽 | 否 | 0 |
| height | double | 高 | 否 | 0 |
| padding | EdgeInsetsGeometry | 内边距 | 否 | EdgeInsets.zero |
| ringWidth | int | 圆环宽度 | 否 | 50 |
| data | `List` | 饼图数据 | 是 | |
| fontSize | double | 选中时展示文字大小 | 否 | 12 |
| fontColor | Color | 选中时展示文字颜色 | 否 | Colors.white |
| selectedItem | BrnDoughnutDataItem? | 选中的项目 | 否 | |
| selectCallback | BrnDoughnutSelectCallback? | 选中项目时候的回掉 | 否 | |
| showTitleWhenSelected | bool | 是否仅在选中时展示 title | 否 | false |
### 其他数据
```dart
DoughnutChartLegend(
{this.legendStyle = BrnDoughnutChartLegendStyle.wrap,
required this.data});
```
## 四、代码演示
### 效果一
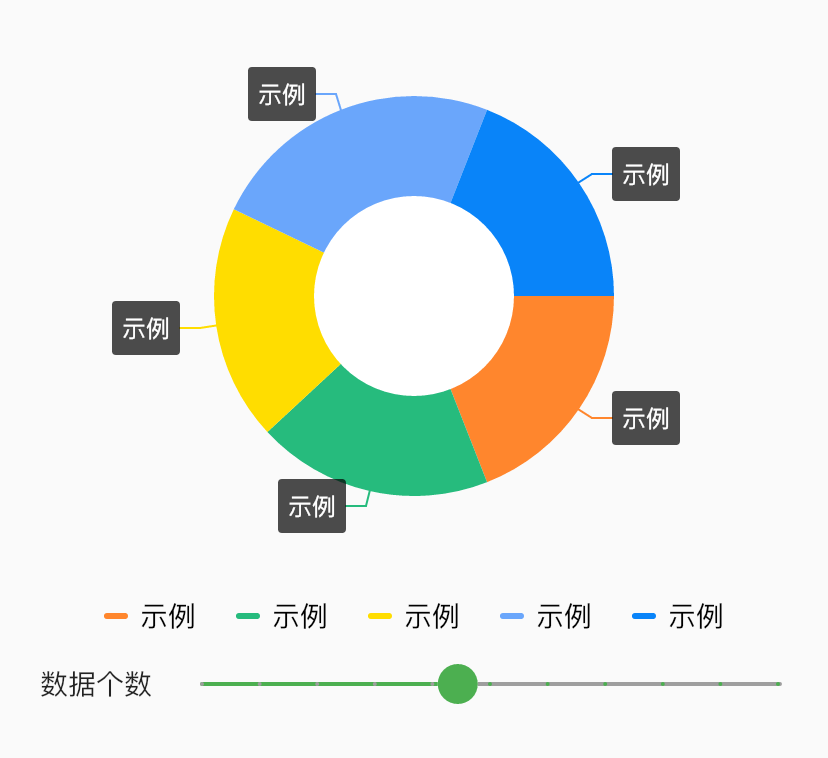 ```dart
Column(
children: [
BrnDoughnutChart(
padding: EdgeInsets.all(50),
width: 200,
height: 200,
data: dataList,
selectedItem: selectedItem,
showTitleWhenSelected: true,
selectCallback: (BrnDoughnutDataItem? selectedItem) {
setState(() {
this.selectedItem = selectedItem;
});
},
),
DoughnutChartLegend(data: this.dataList, legendStyle: BrnDoughnutChartLegendStyle.wrap),
Row(
crossAxisAlignment: CrossAxisAlignment.center,
children: [
Padding(
padding: EdgeInsets.only(left: 20),
child: Text('数据个数'),
),
Expanded(
child: Slider(
value: count.toDouble(),
divisions: 10,
onChanged: (data) {
setState(() {
this.count = data.toInt();
dataList.clear();
for (int i = 0; i < count; i++) {
dataList.add(BrnDoughnutDataItem(
title: '示例',
value: random(1, 5).toDouble(),
color: getColorWithIndex(i)));
}
});
},
onChangeStart: (data) {},
onChangeEnd: (data) {},
min: 1,
max: 10,
label: '$count',
activeColor: Colors.green,
inactiveColor: Colors.grey,
semanticFormatterCallback: (double newValue) {
return '${newValue.round()}}';
}),
),
],
),
],
)
```
```dart
Column(
children: [
BrnDoughnutChart(
padding: EdgeInsets.all(50),
width: 200,
height: 200,
data: dataList,
selectedItem: selectedItem,
showTitleWhenSelected: true,
selectCallback: (BrnDoughnutDataItem? selectedItem) {
setState(() {
this.selectedItem = selectedItem;
});
},
),
DoughnutChartLegend(data: this.dataList, legendStyle: BrnDoughnutChartLegendStyle.wrap),
Row(
crossAxisAlignment: CrossAxisAlignment.center,
children: [
Padding(
padding: EdgeInsets.only(left: 20),
child: Text('数据个数'),
),
Expanded(
child: Slider(
value: count.toDouble(),
divisions: 10,
onChanged: (data) {
setState(() {
this.count = data.toInt();
dataList.clear();
for (int i = 0; i < count; i++) {
dataList.add(BrnDoughnutDataItem(
title: '示例',
value: random(1, 5).toDouble(),
color: getColorWithIndex(i)));
}
});
},
onChangeStart: (data) {},
onChangeEnd: (data) {},
min: 1,
max: 10,
label: '$count',
activeColor: Colors.green,
inactiveColor: Colors.grey,
semanticFormatterCallback: (double newValue) {
return '${newValue.round()}}';
}),
),
],
),
],
)
```